Three diagrams covering the system end to end — a project overview first, then the full pipeline, then a closer look at the predicate-linking step specifically.
Figure 1 — Project Overview
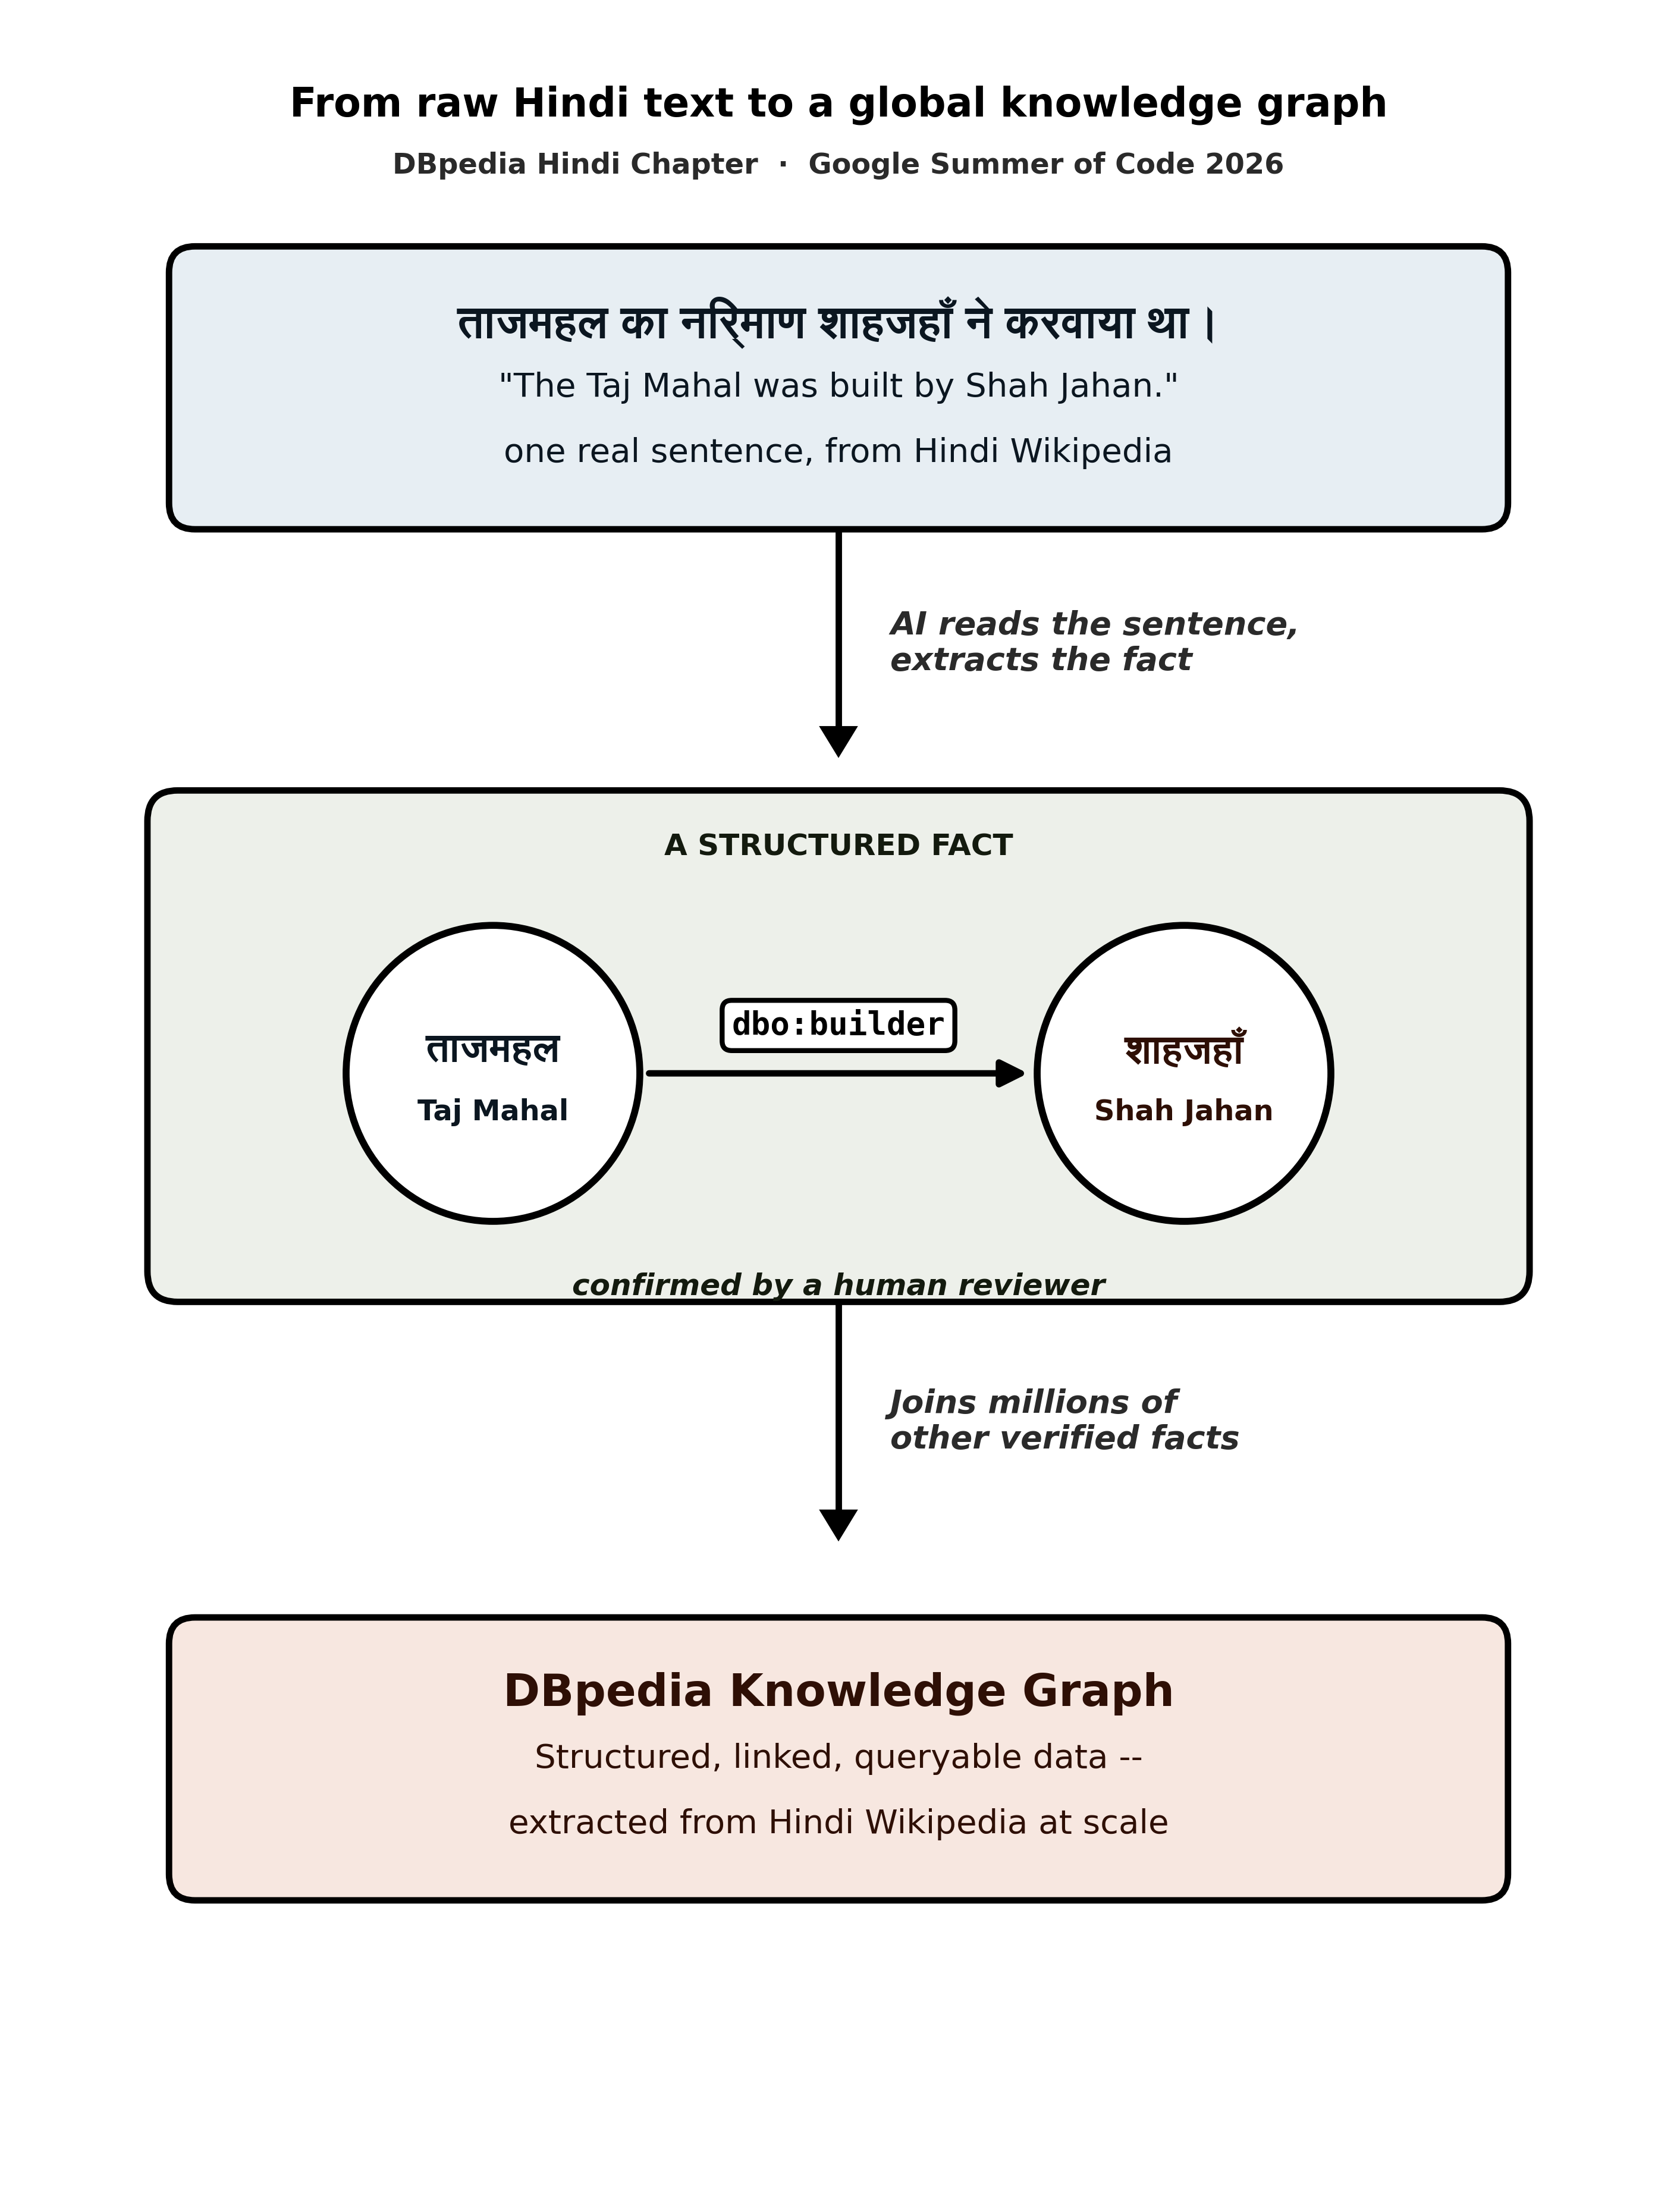 High-level view of the project — motivation, pipeline, and outcome.
Figure 2 — End-to-End Pipeline
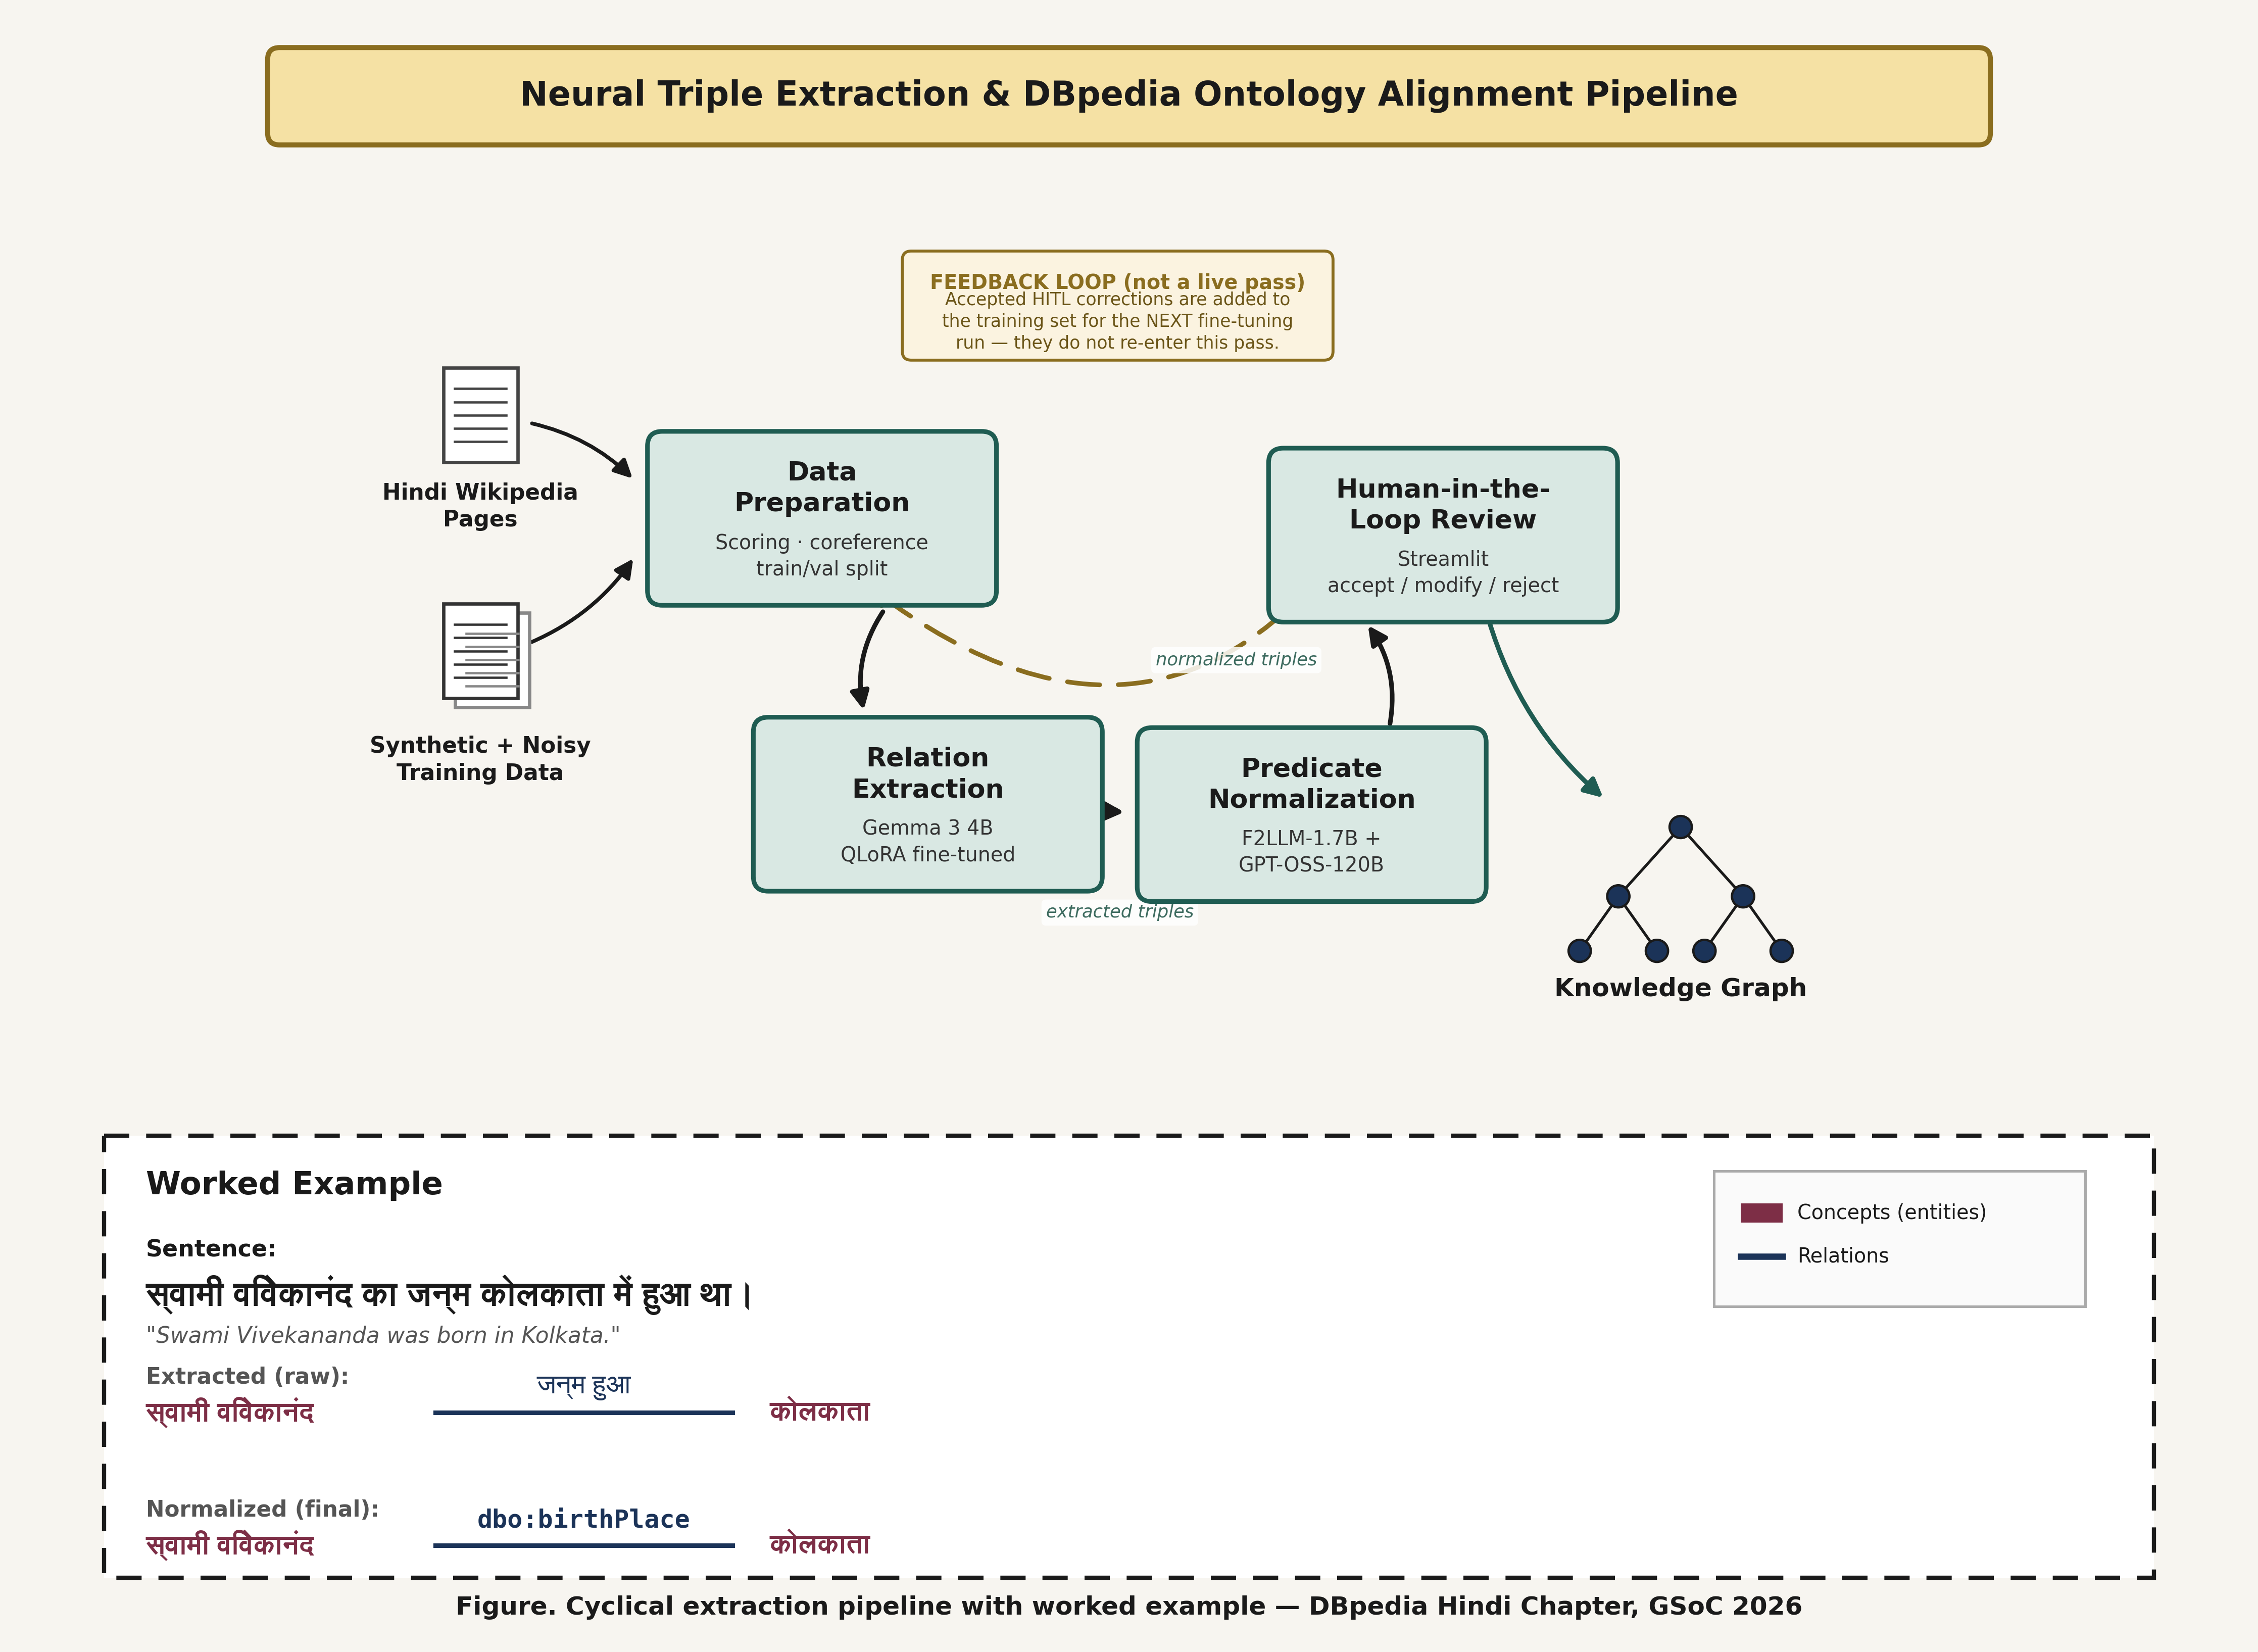 The complete pipeline, including the feedback loop and a real worked example.
Figure 3 — Predicate Linking
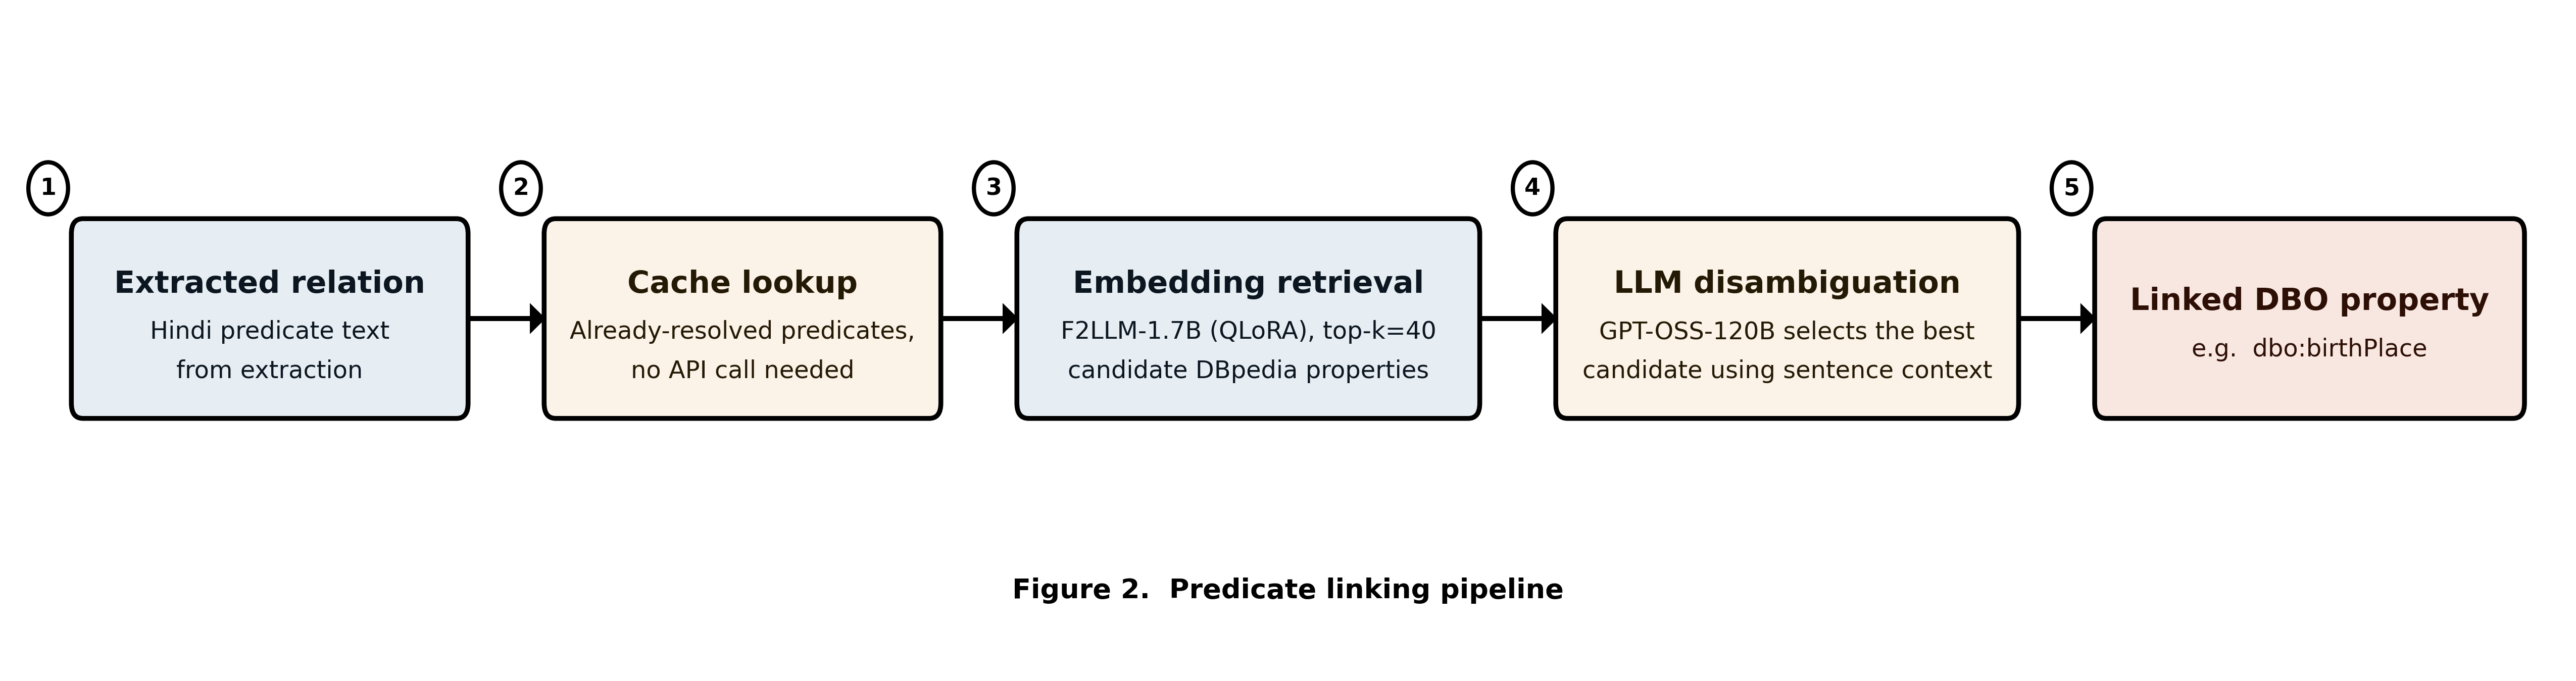 Detail of the normalization step — this is what reached 89.9% precision@40 (Week 9).
Footnotes